
Fig. 1. History of the people (P) and trees (T) predicted by the Brander-Taylor Model. Time is in units of 250 years, and the human population peaks at a value of about 10,000 people.

Fig. 2. History of the people (P) and trees (T) predicted by the Basener-Ross Model. Time is in units of millennia, and the population peaks at a value of about 9400 people.

Fig. 3. A periodic solution predicted by the Basener-Ross Model. The unit of time is about 7 years, and the human population oscillates between about 1300 and 30,000 people.
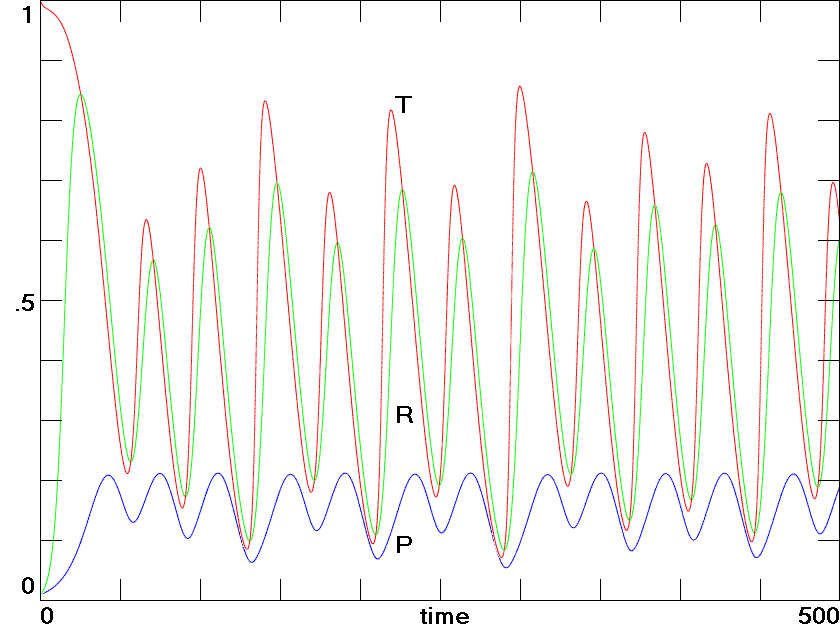
Fig. 4. A chaotic solution predicted by the Invasive Species Model. The unit of time is years, and the human population averages about 7200 people.
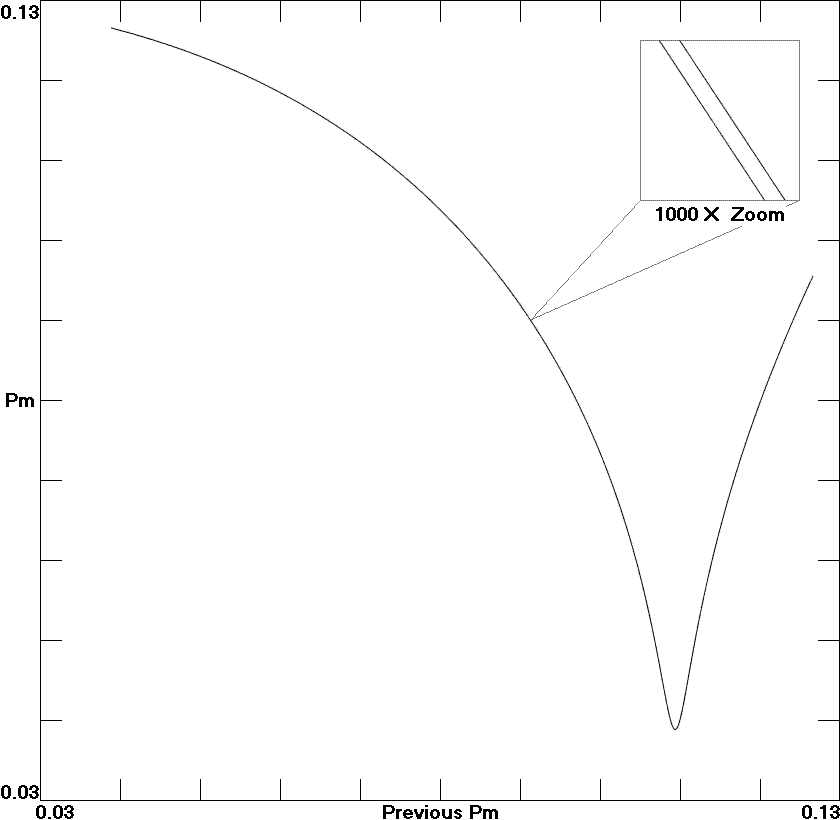
Fig. 5. A return map showing the minimum human population versus the previous minimum for the chaotic Invasive Species Model.
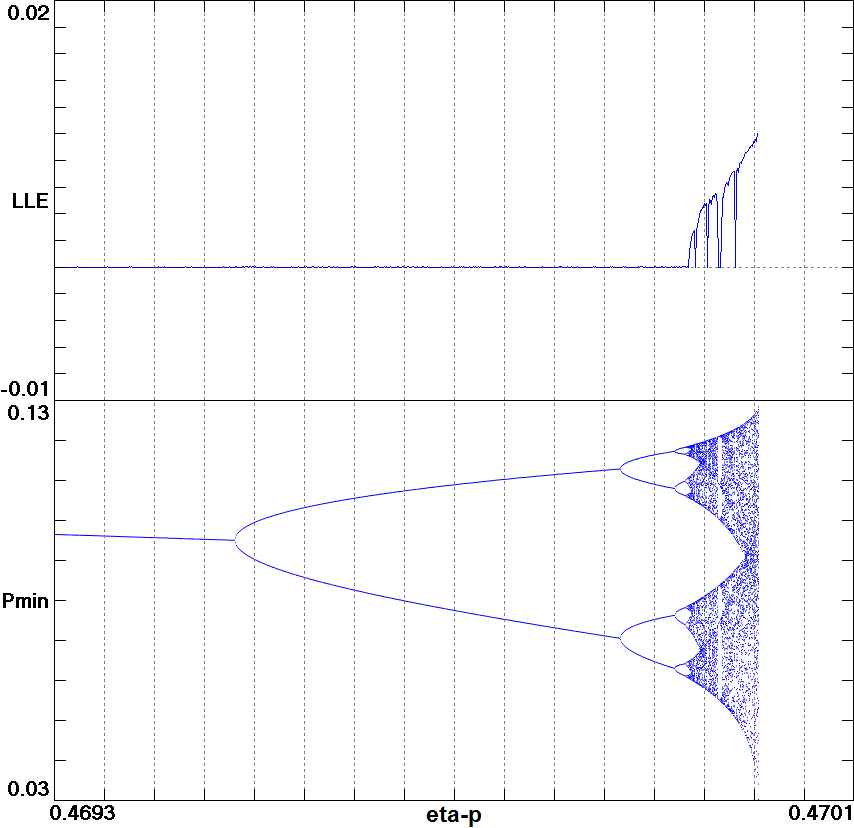
Fig. 6. Largest Lyapunov exponent and minimum value of the human population as a function of the tree-harvest rate for the Invasive Species Model shows a period-doubling route to chaos followed by mass extinction.
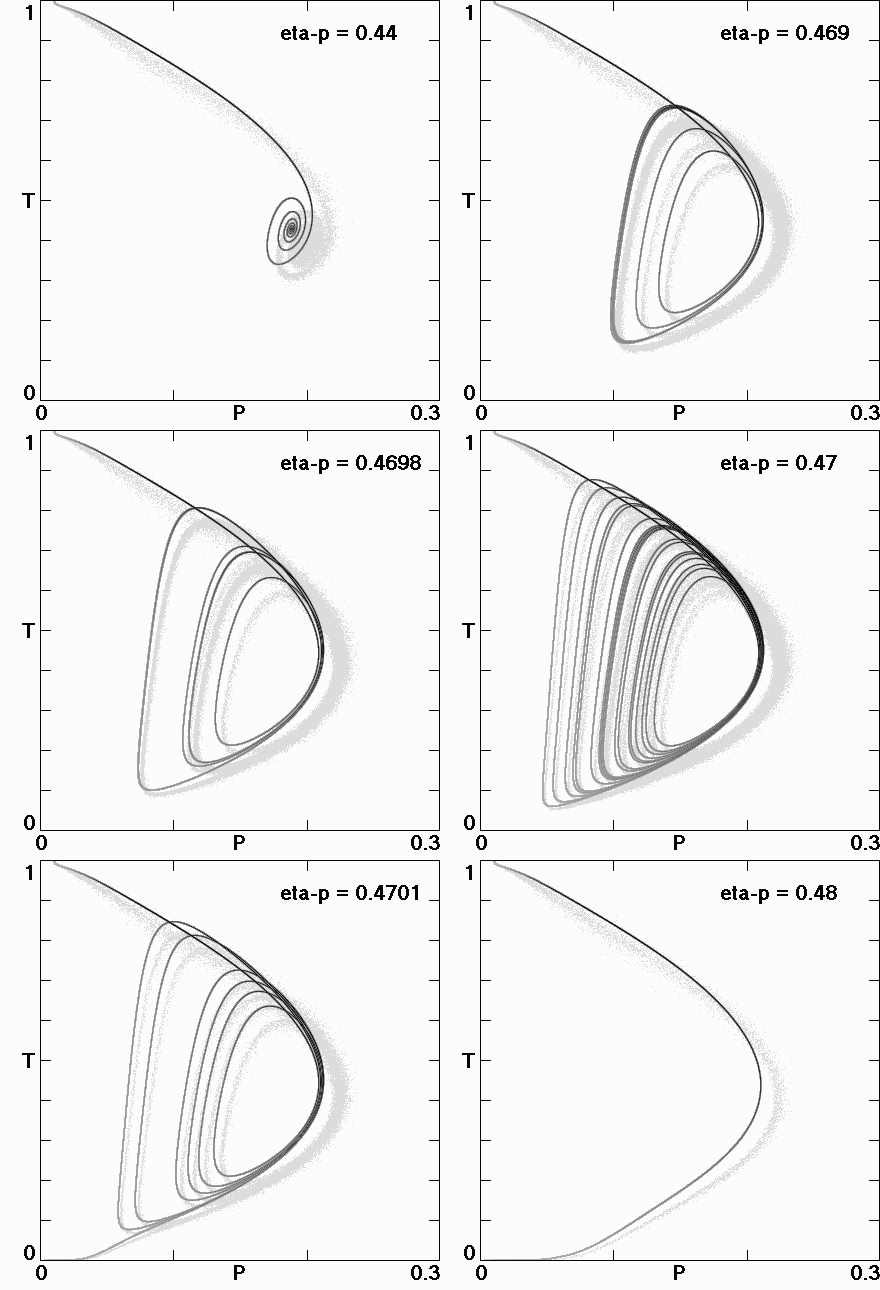
Fig. 7. State space plots for the Invasive Species Model at increasing values of the harvesting rate showing successively attraction to the coexisting equilibrium, a simple limit cycle, a period-doubled limit cycle, a chaotic attractor, transient chaos, and rapid extinction.
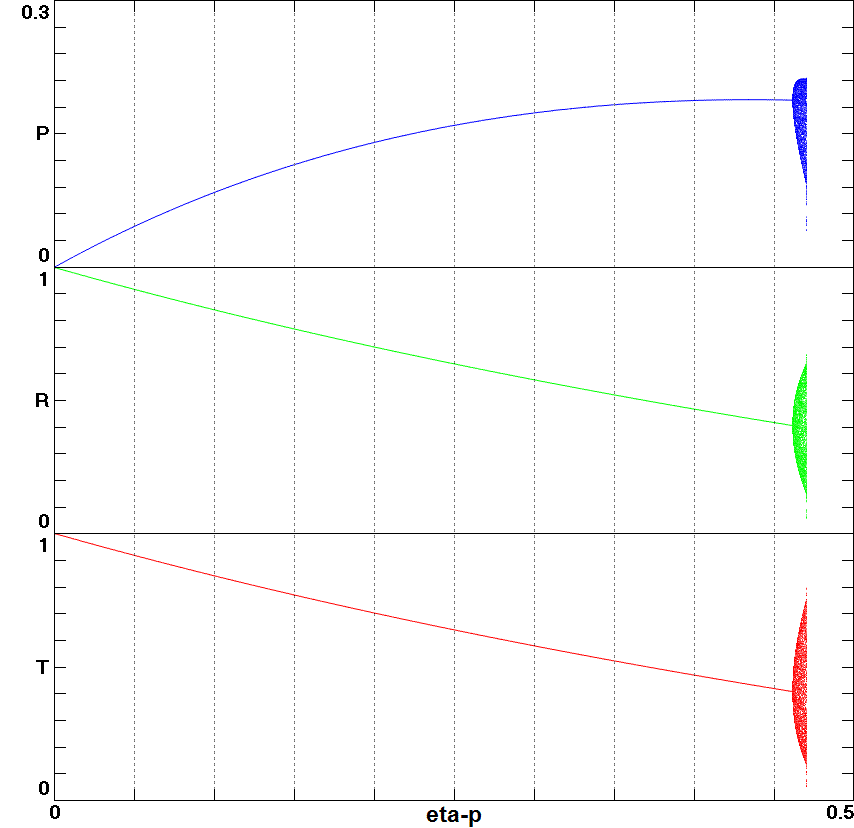
Fig. 8. Population of people (P), rats (R), and trees (T) permitted by the Invasive Species Model as a function of tree harvesting rate, showing the narrow region of periodic and chaotic oscillations preceding the crash.