Fig. 1. Kaplan-Yorke dimension and Lyapunov exponents versus b showing the route to chaos.
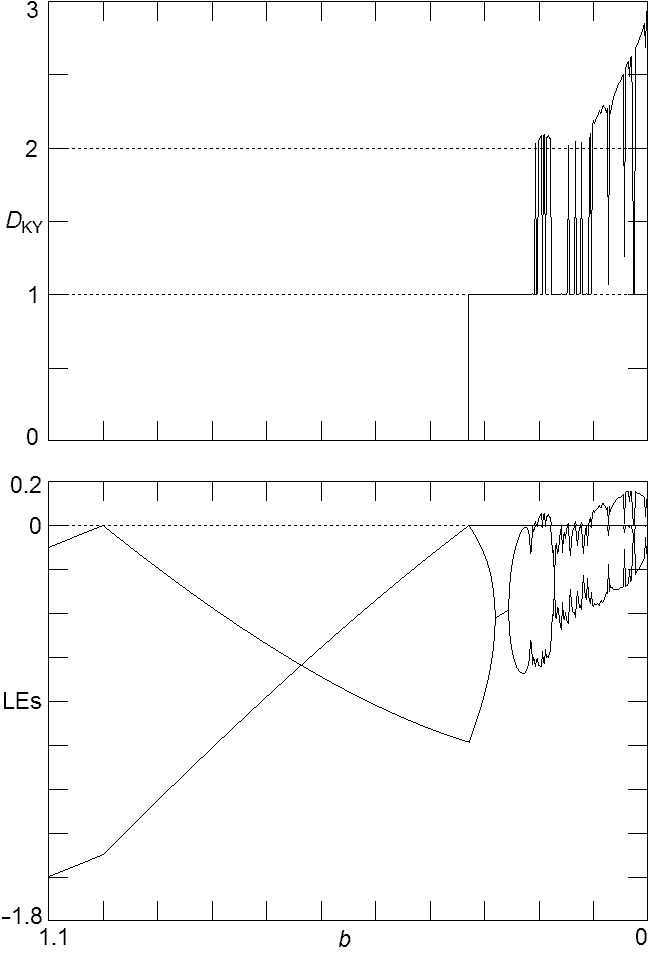
Fig. 2. Bifurcation diagram (local maximum of x) and Lyapunov exponents versus b showing the route to chaos in greater detail.

Fig. 3. Kaplan-Yorke dimension and Lyapunov exponents versus b showing the route to chaos. In the upper plot, the circles with error bars are values of the correlation dimension.

Fig. 4. Cross-section of the attractor in yz-space at x = 0 for four values of b. The axes are -20 to 20 for each case.

Fig. 5. Standard deviation and kurtosis for the excursion of the trajectory from the origin for the attractors as a function of b.

Fig. 6. Plot showing regions of multiple coexisting attractors as a function of b.

Fig. 7. Multiple coexisting attractors.
Fig. 8. Six coexisting strange attractors at b = 0.203.
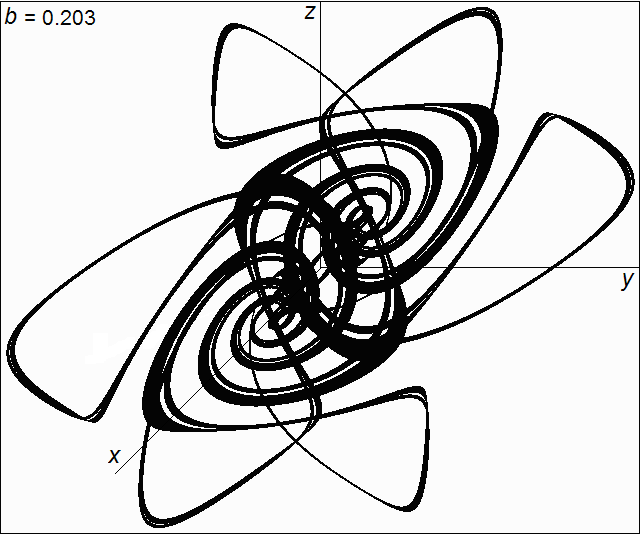
Fig. 9. Cross-section of the chaotic sea at (x mod 2pi) = 0 for the conservative case with b = 0.

Fig. 10. Stereogram showing the regions where quasiperiodic trajectories occur for b = 0. The view is looking down along the x-axis, and the different colors denote the six directions in which trajectories drift.

Fig. 11. Cross-section at (x mod 2pi) = 0 showing the quasiperiodic orbits for b = 0 surrounded by a KAM surface.
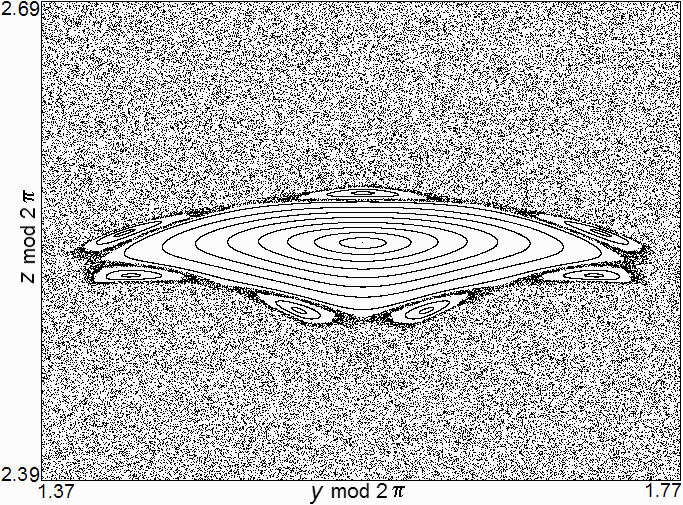
Fig. 12. Brownian motion of a trajectory in the chaotic sea (black) along with a quasiperiodic trajectory (red).
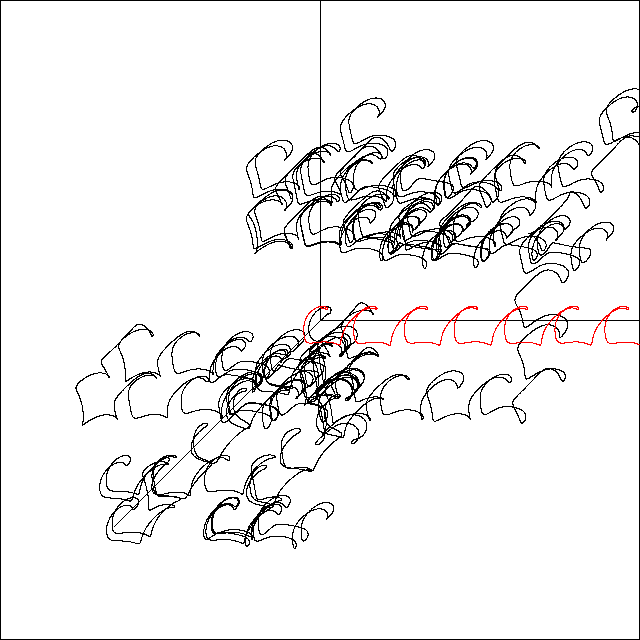
Fig. 13. Probability distribution function of x for 5 × 10⁶ initial conditions near the origin after a time of 4 × 10³. The red curve is a Gaussian distribution with the same standard deviation and area.

Fig 14. Projection of the trajectory onto the x-axis showing an example of intermittency where the trajectory approaches the quasiperiodic region with initial conditions (0.05, 0.09, 0.05).

Fig. 15. Standard deviation of 1.5 × 10⁶ trajectories starting near the origin versus time.

Fig. 16. (a) Range versus time, and (b) autocorrelation function of dx/dt versus delay for an initial condition of (0.2, 0, 0).

Fig. 17. Allowable transitions for symbolic sequence.
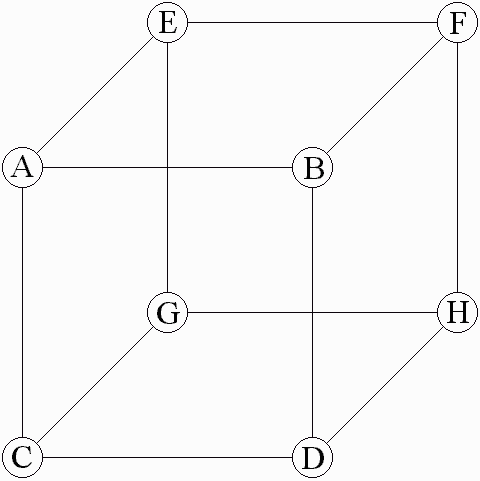
Fig. 18. Iterated function system representation of symbolic dynamic.
